Radar
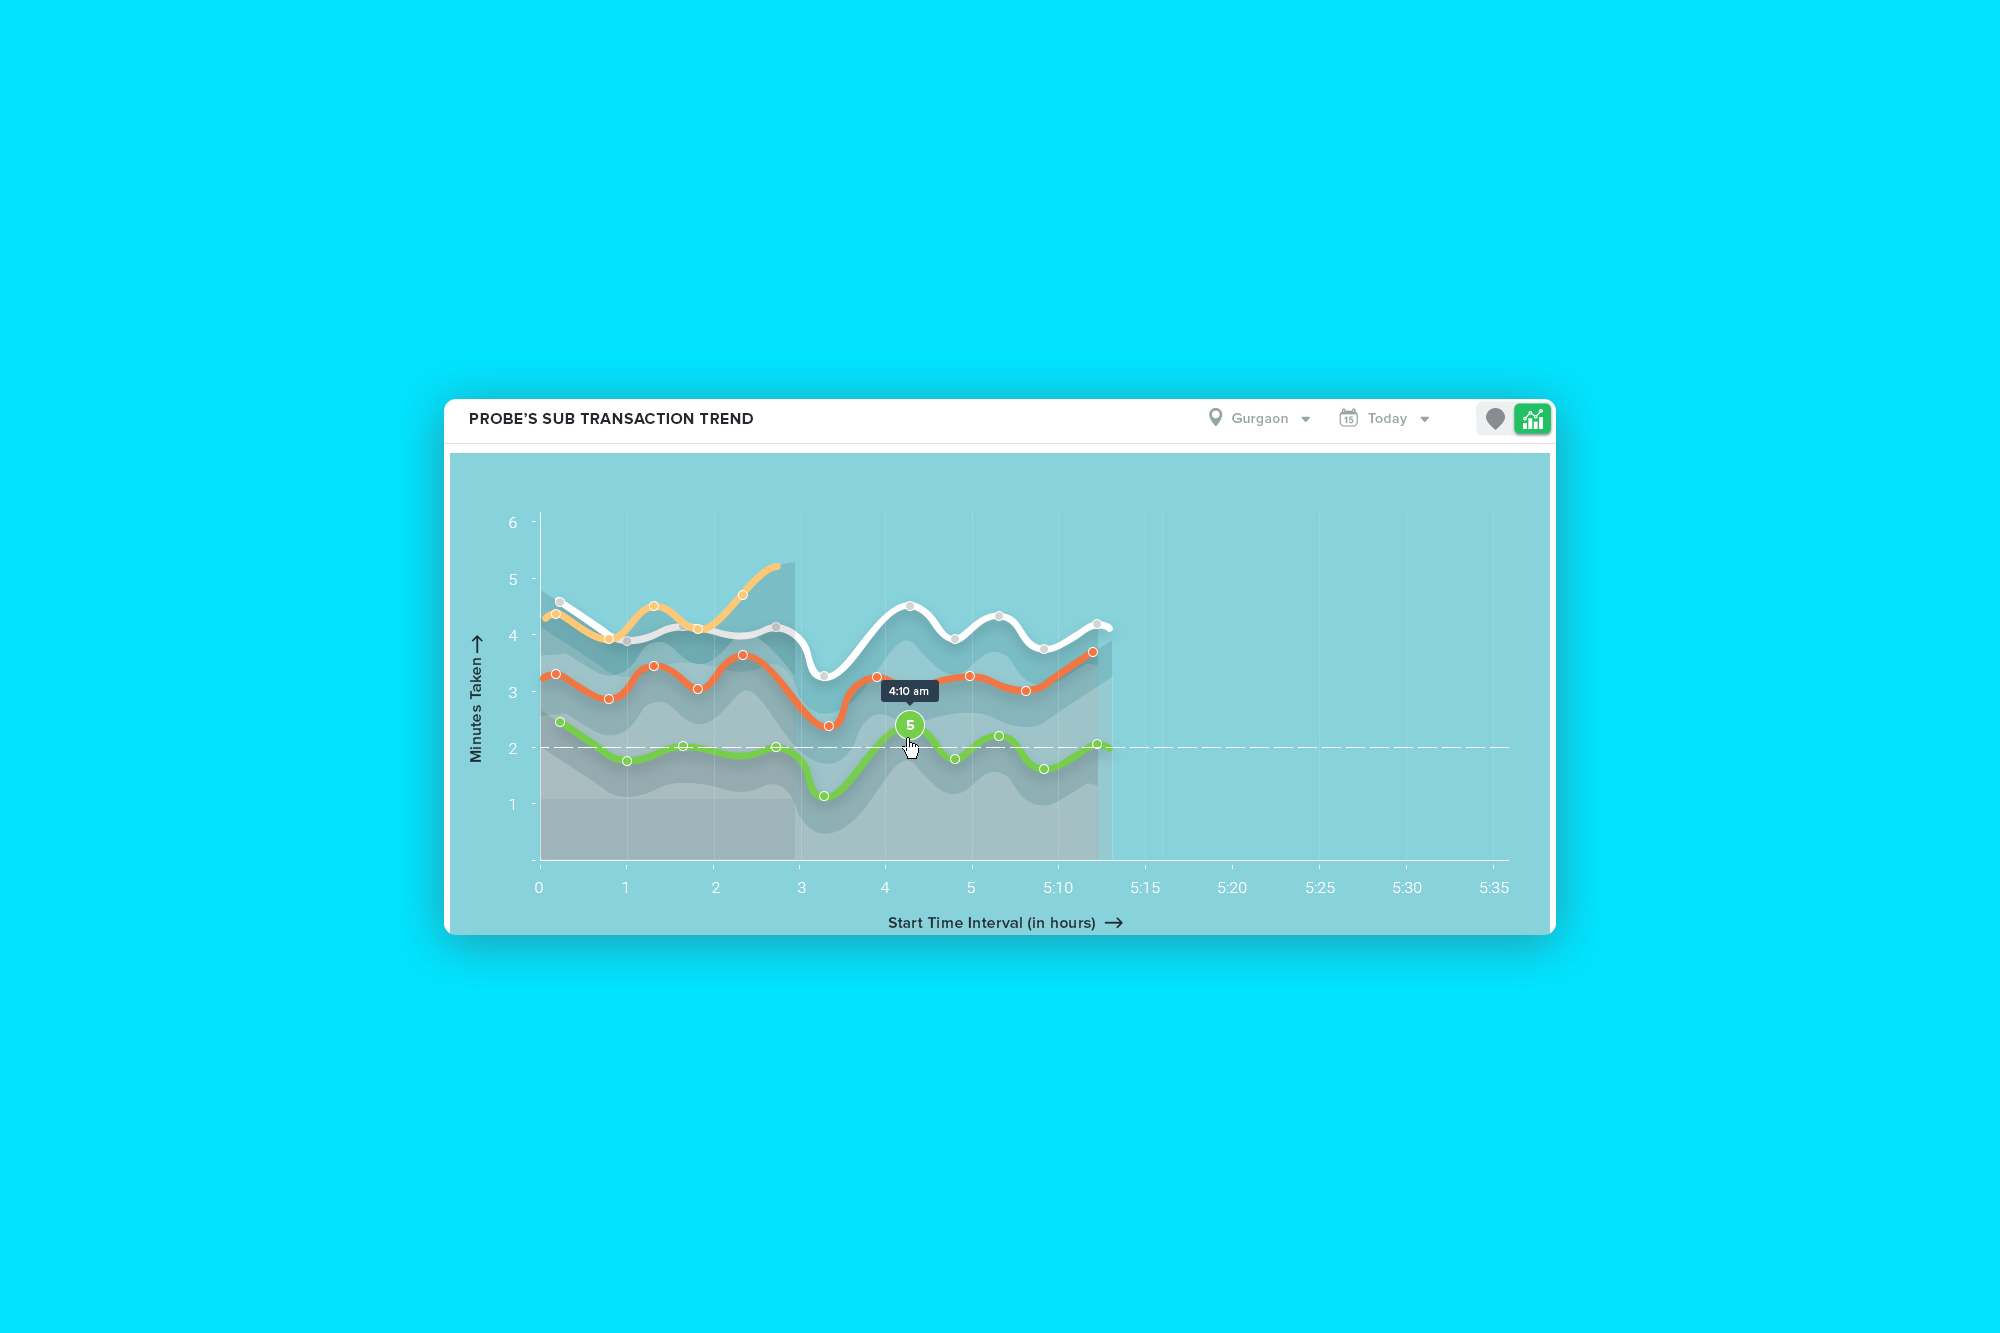
It's an undercover project which I led and designed. The product is for the use of major telecom operators like Airtel, Vodafone to get insight into technical problems in their various services like calling, data, SMS. The project duration was 4 months from making to the launch, So now here's the story revealing of that period.
MY ROLE
I led the data analysis & design of RADAR ERP for the digital across Web and Mobile since the outset of the project.
I led efforts to identify KPIs, evolve the UI/UX and address customer pain points to the technical department to solve those problems for better telecommunication services.
THE CHALLENGE
4 MONTHS ( KPI ANALYSIS + WEB APP + ANDROID APP )
The client was an Indian MNC in telecom sector. Though I can't share more because of the NDA between us. Their main task was to showcase the right metrics plots with precise logics on a DASHBOARD. The platform was to be used by tech managers of major telecom companies. As the tech team was getting tons of data from their servers but there the current system was too cluttered to provide the needed insights.
The platform was being built to work on two types of devices:
1. Mobile app ( being used by field operators during the field visits to collect systems information )
2. Web app ( being used by remote technical department authority to monitor the issues & ensure the proper working of the system )
THE START
STAKEHOLDER MEETINGS ( KNOWLEDGE SHARING )
This was a whole new sector for me to build some product around. During the first meeting the client showed their existing platform. But I had no clue about the terminologies that were being used in their system. So we scheduled few extra meetings in the start to understand the product language, technical nomenclatures, actual working of the product etc.
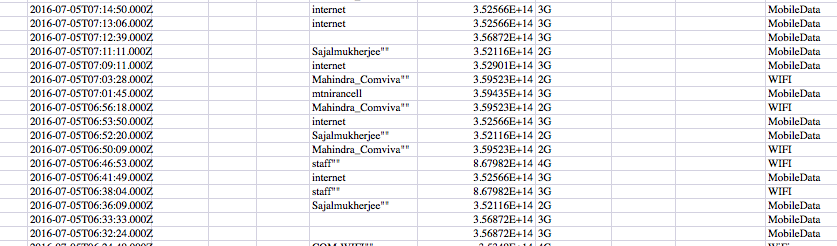
These kind of huge excel sheets with data points were being exported from their servers
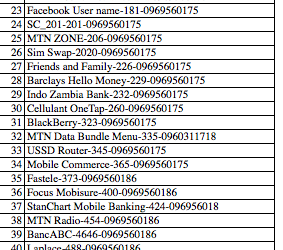
After these meetings, We had a clear & mutual understanding of the product. Within few days, I was like a tech expert in using the telecom linguistics. For better clarity, The client shared multiple documents & research sheets from their end.
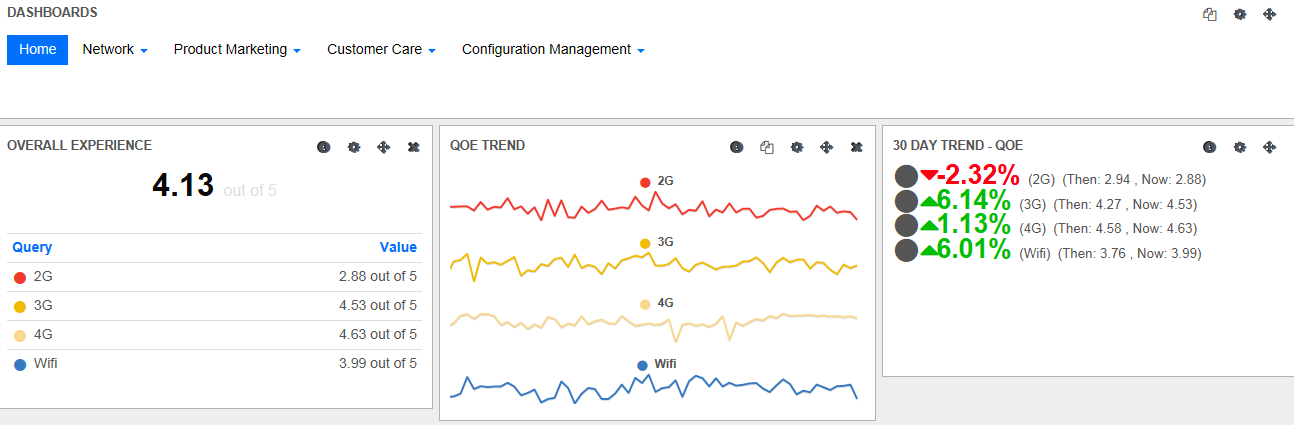
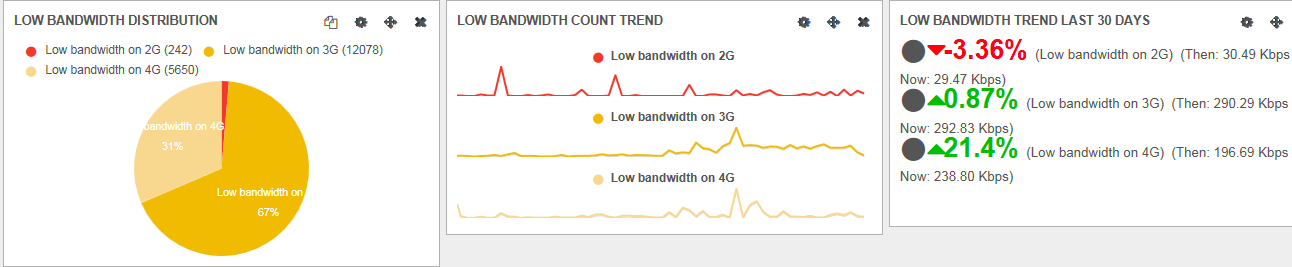
The initial platform looked so cluttering & outdated.
THE ANALYSIS
DECODING THE TECH COMPLEXITY
As the major output expected from the platform was to provide decision making insights. That task was solely in my hands. The technical team was ready for me with every resource to help out with.
For the intended purpose, I laid out the key visualisation components that could help out in showcasing the data on the platform. The main ones I wrote down were charts, tables & notifications. Before to begin with, There was a lot of research involved to understand the better functioning of telecom parameters.
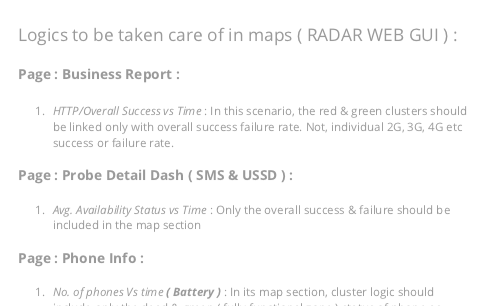
After that a proper documentation of the logics needed to be made based on what the charts being plotted. It took a lot of time in setting the best parameters against each other in relation on the chart graphs. Other than this, A pattern table was decided to fit in. This was to showcase the increasing or decreasing behaviour of various parameters that would effect the telecom services.
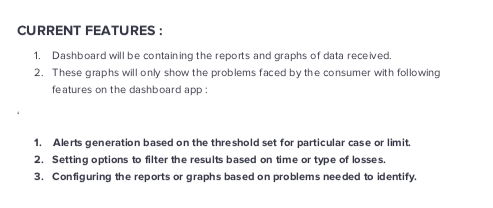
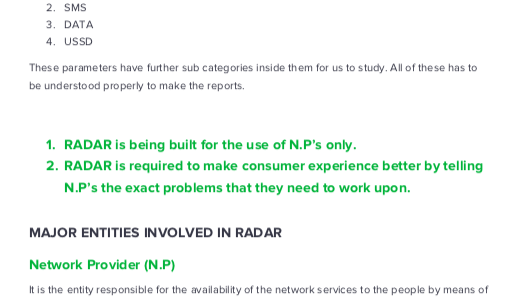
A glimpse of the documentation
THE SPRINT
STAGING THE CONCEPTS
It was time for the ideas to turn into shape to understand the meaning better. We started building sketches from design sprints. Once the sprints got over, We were ready with the needed parametric components to be injected into the product.
Before starting the sprint, The main personas were clearly defined for both web & mobile app. The main persona for the mobile app were the field operators who would visit the device locations to detect & diagnose the issue. The app was to be built to work automatically in background to collect logs, The operators were just supposed to keep it active during the duty hours.
The second stakeholder persona were the authority that sit on remote offices to monitor the telecom services quality for an specific region. They had to be provided with a upfront dashboard system where they can easily get insights to diagnose the issues in the shortest time.
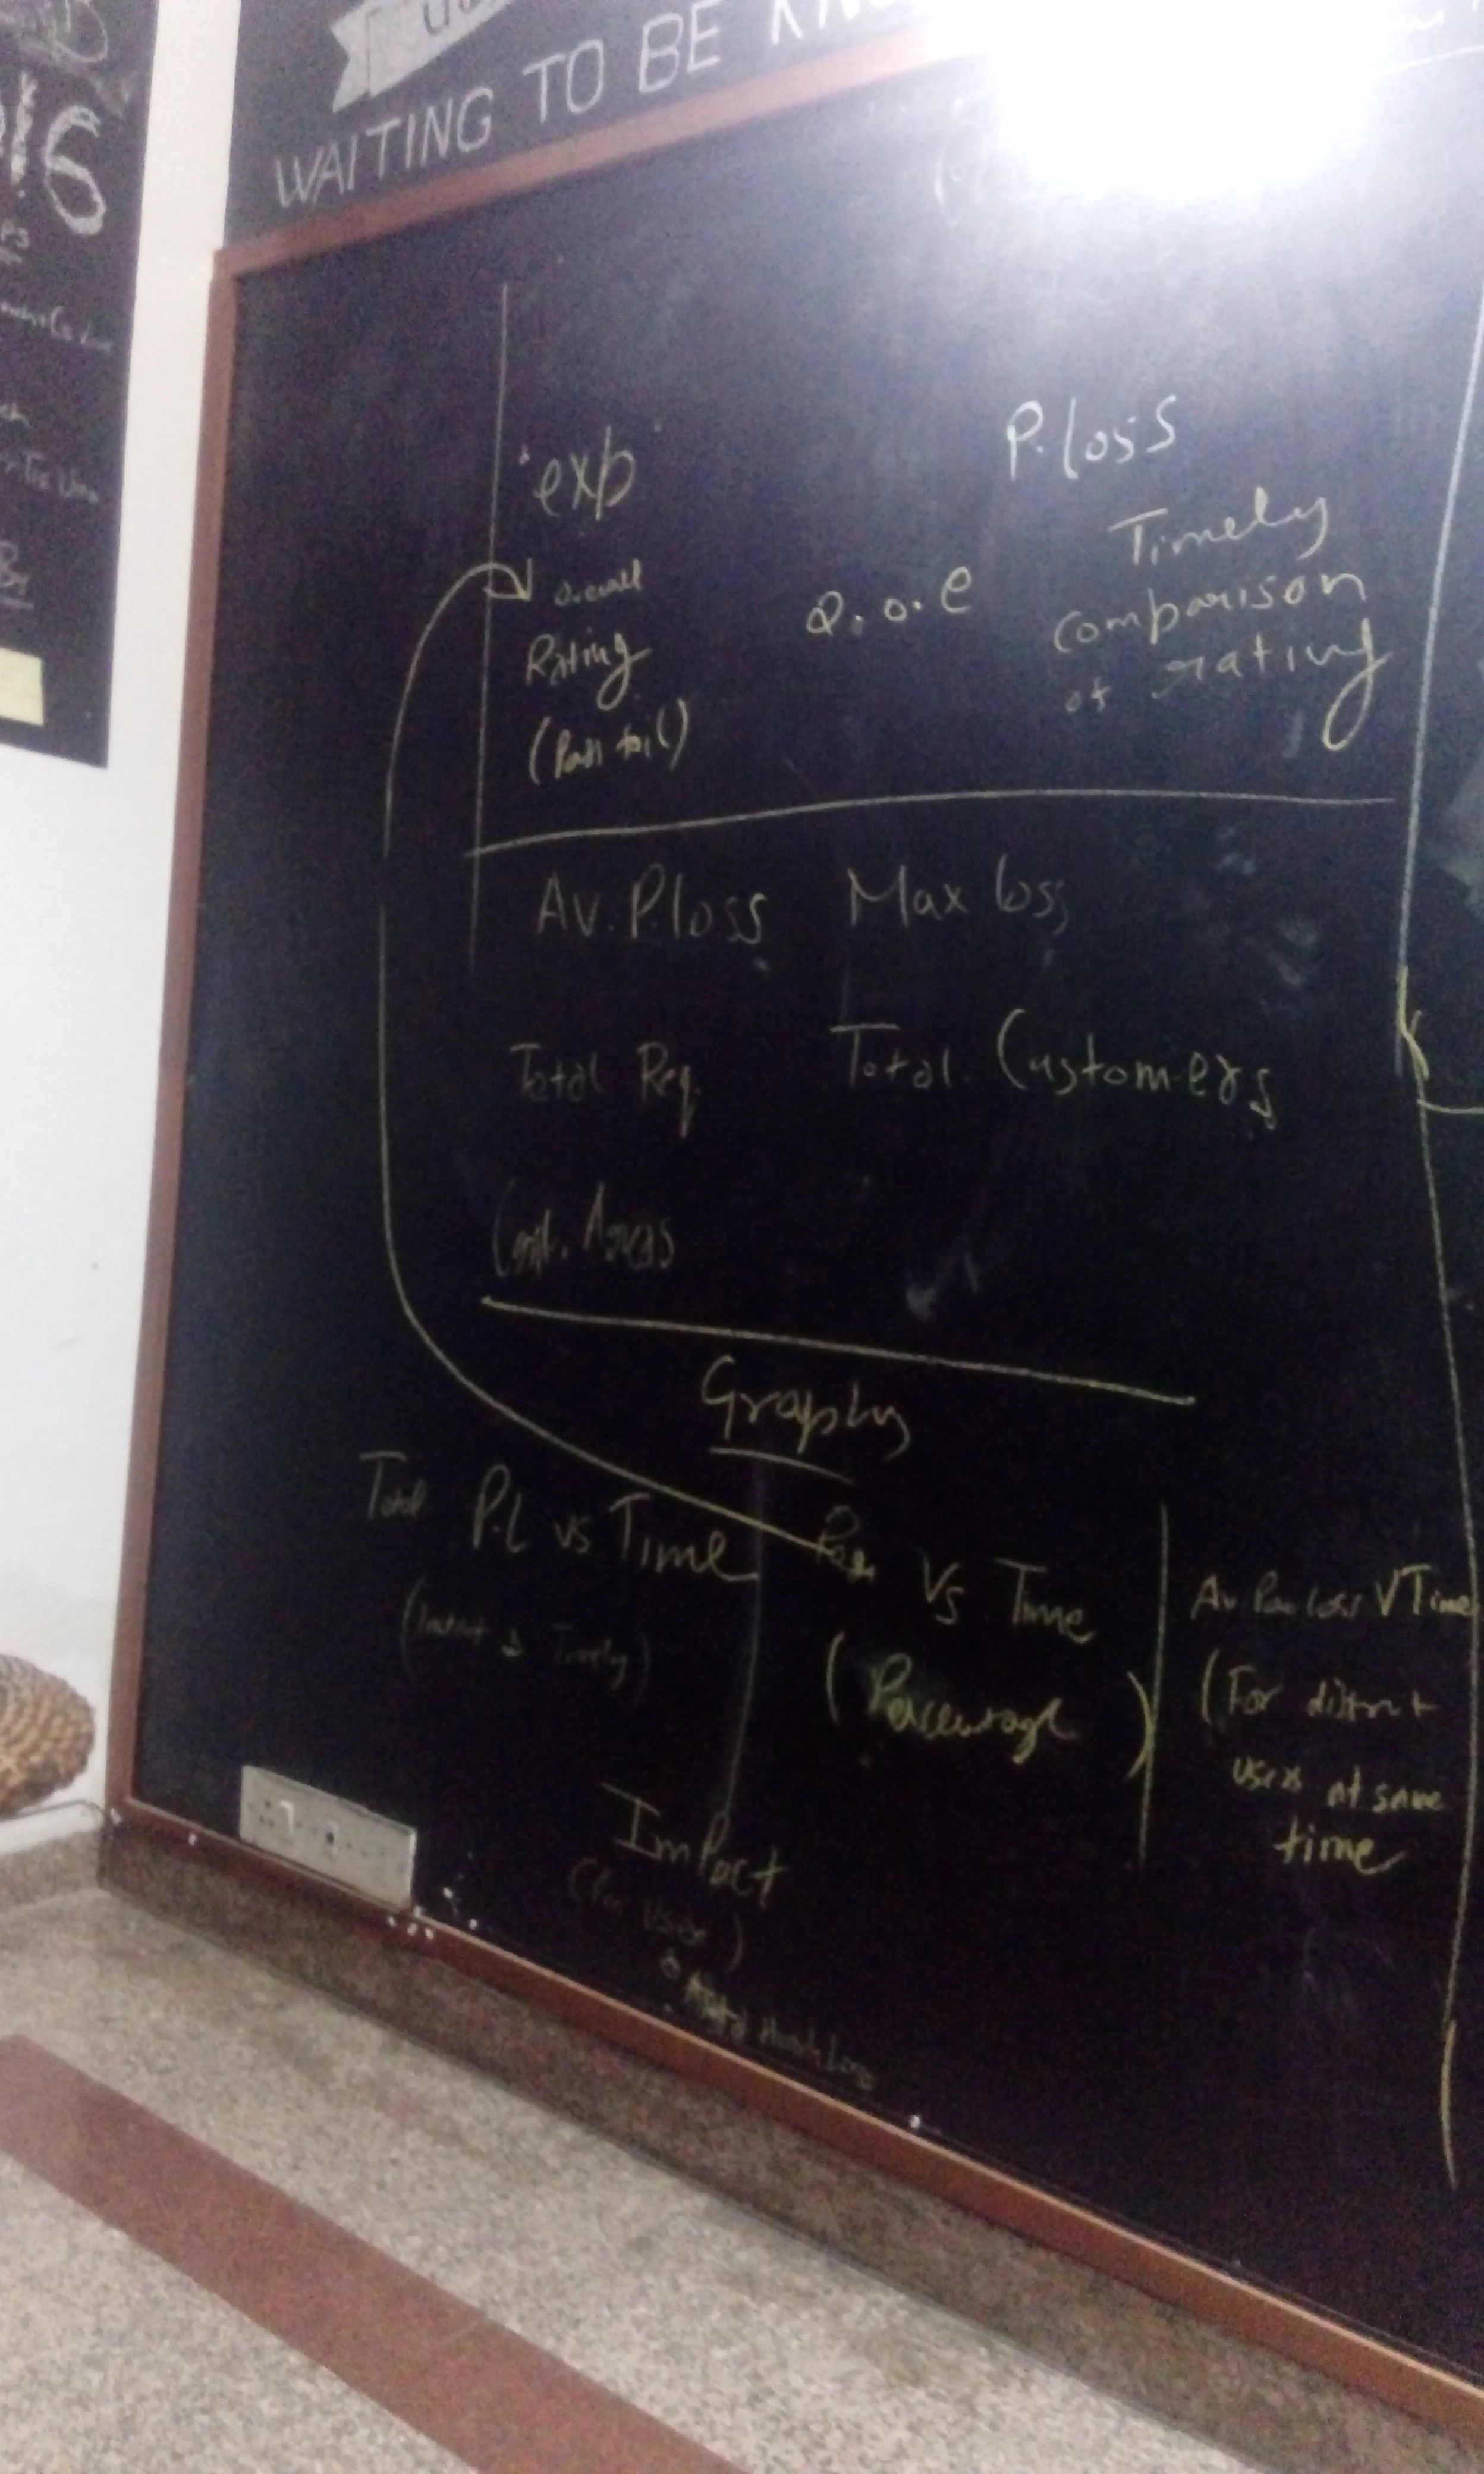
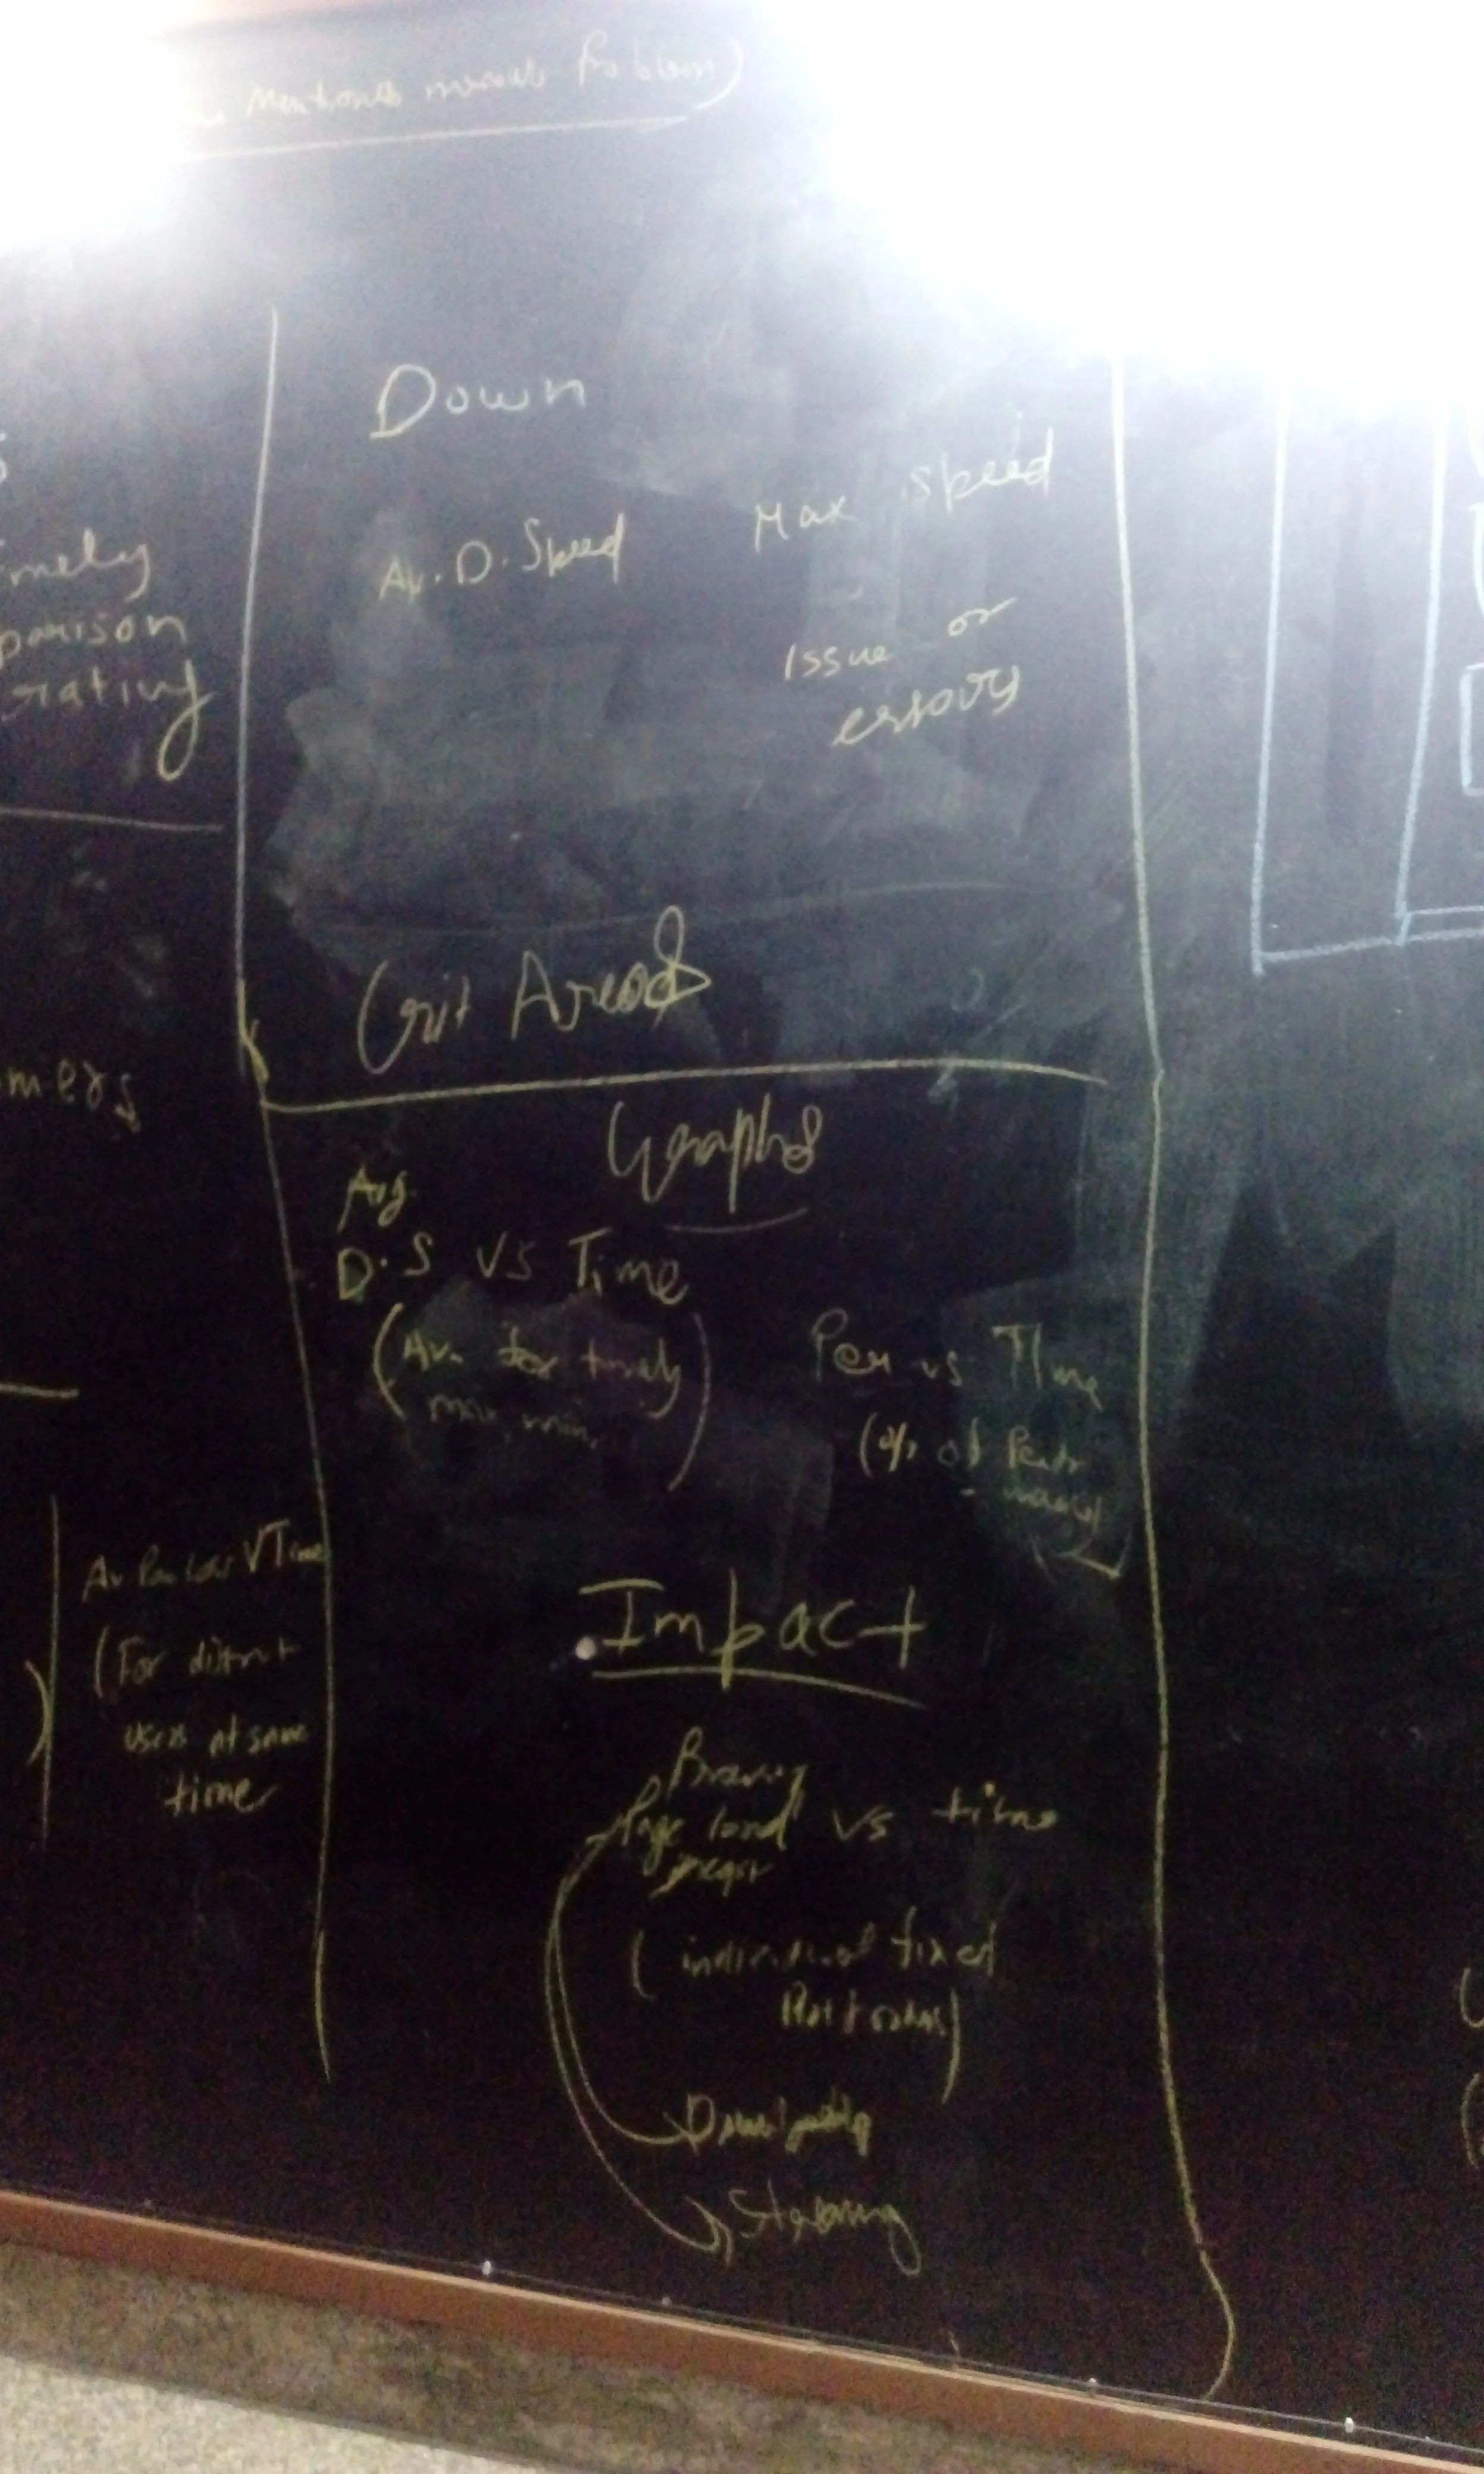
A look at brainstormed board during sprints
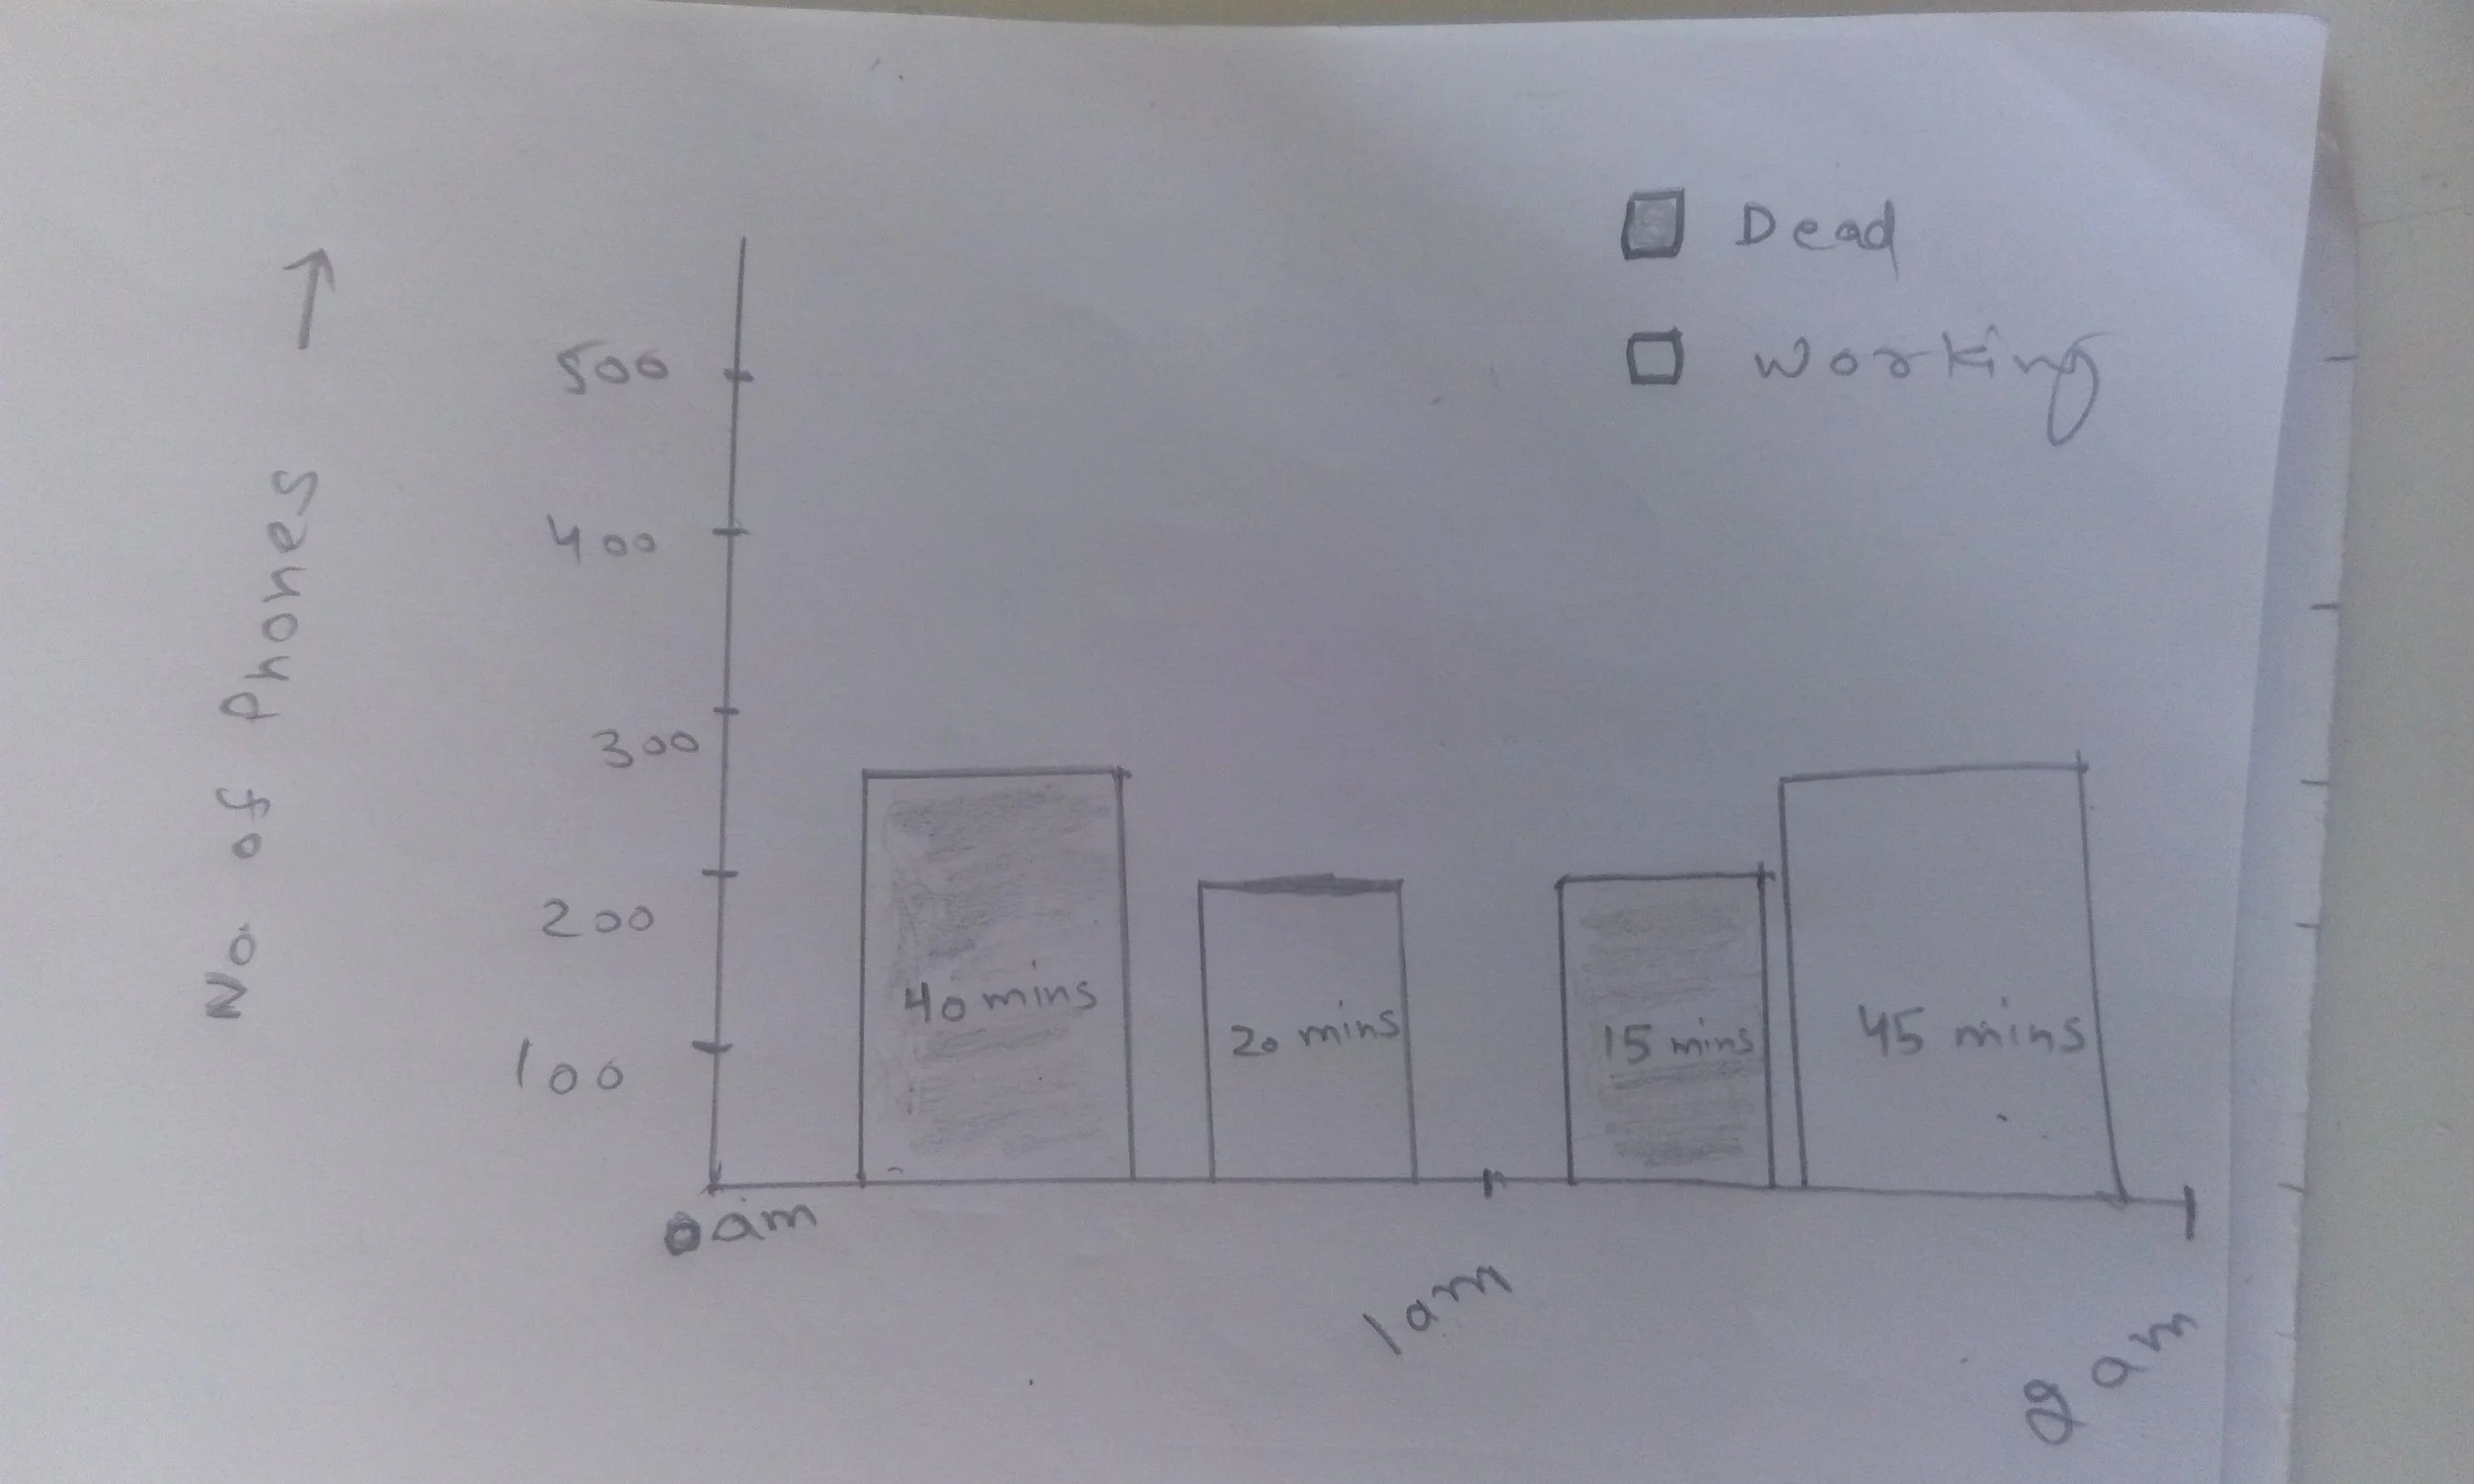
One of the teammate's piece of art sketch during sprint task... just closer to picasso:)
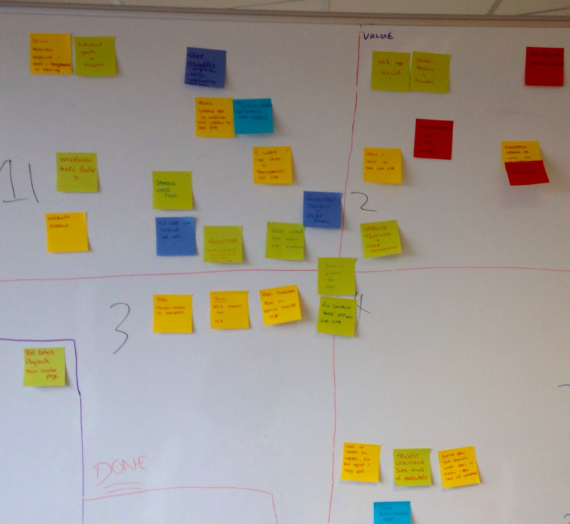
Sticky board full of personas & feature suggestions
THE PROTOTYPING
SHAPING THE IDEAS
After the sprint, We moved to the final prototyping stage. Started from the wireframing & then moved to interactive prototypes.
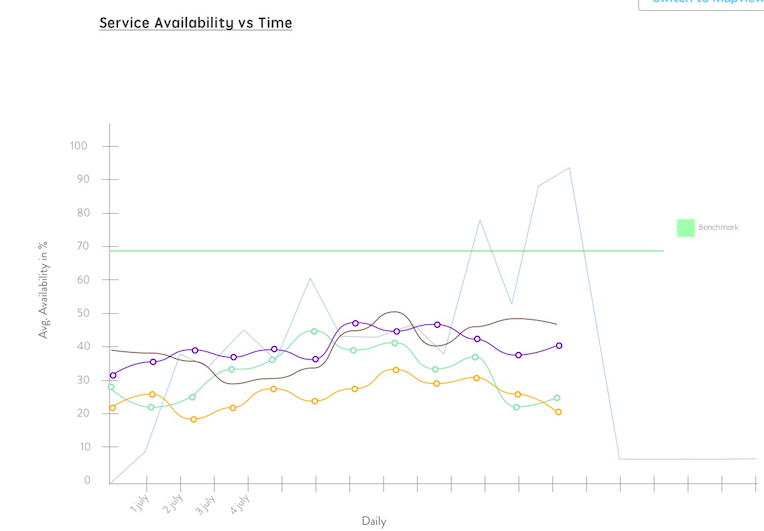
One of the charts for web dashboard made on hi-fi prototype
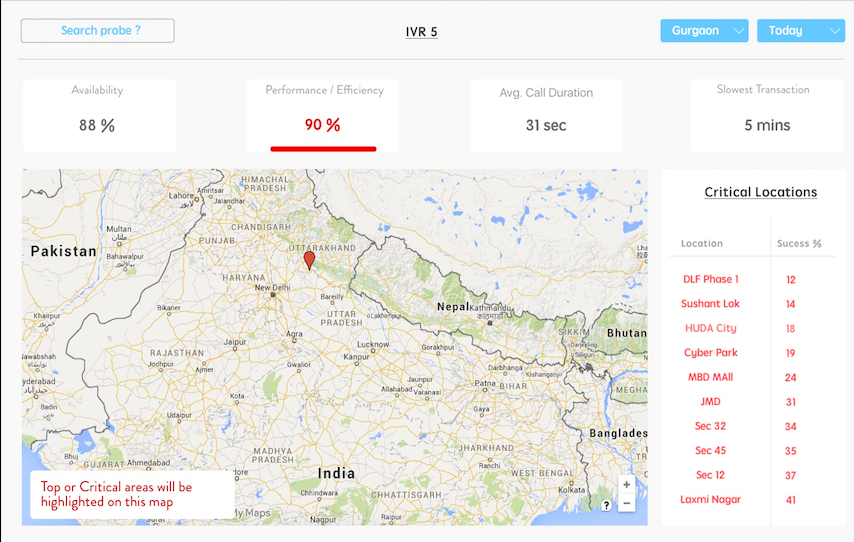
Some wireframes were turned colour to make it easily understandable for the less tech savvy stakeholders
It took 2 weeks to move this stage to an end. There were multiple iterations & technical obstructions that came along the process. A team of 4 developer was set in parallel to overview the tech feasibility on the way. This step really saved us a lot of time for the future road.
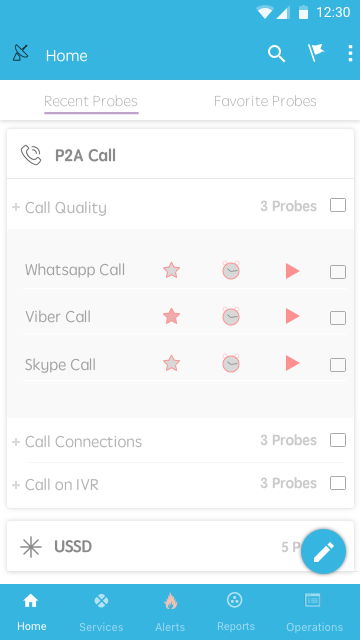
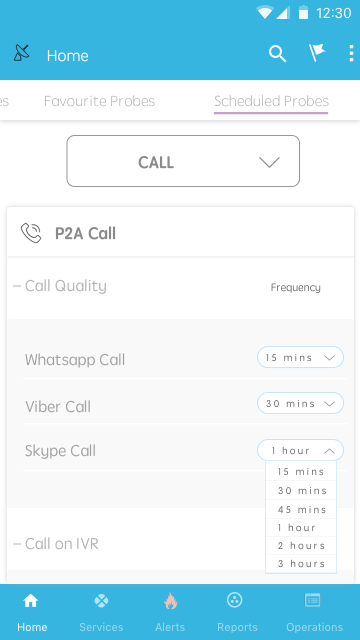
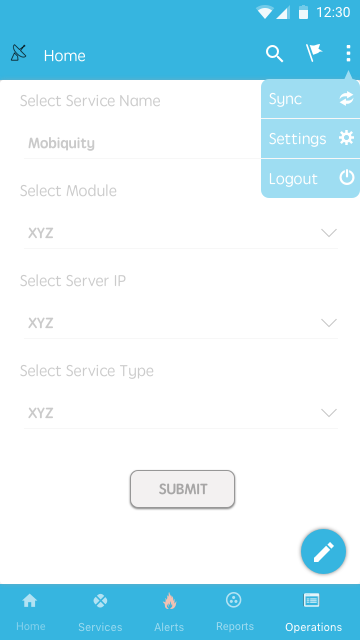
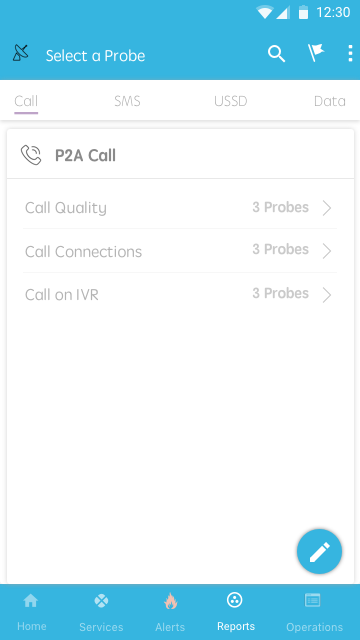
Wireframes for the field operator app
THE REFINEMENT
VISUALIZATION
Finally the stage came to make things look like as they were intended to. The visual design of the web & app started in parallel with a team of 2 additional visual designers. The process was set be completed in next 4 weeks including the iteration period.
We were able to first wrap the mobile app due to its small work size. Quickly after that it was shipped for the development department. On the other hand, The web app was being developed bit by bit. The development of the web also started in parallel component by component. We agreed on this strategy to reduce friction between design & development. Moreover it was about saving more time & unnecessary changes in future.
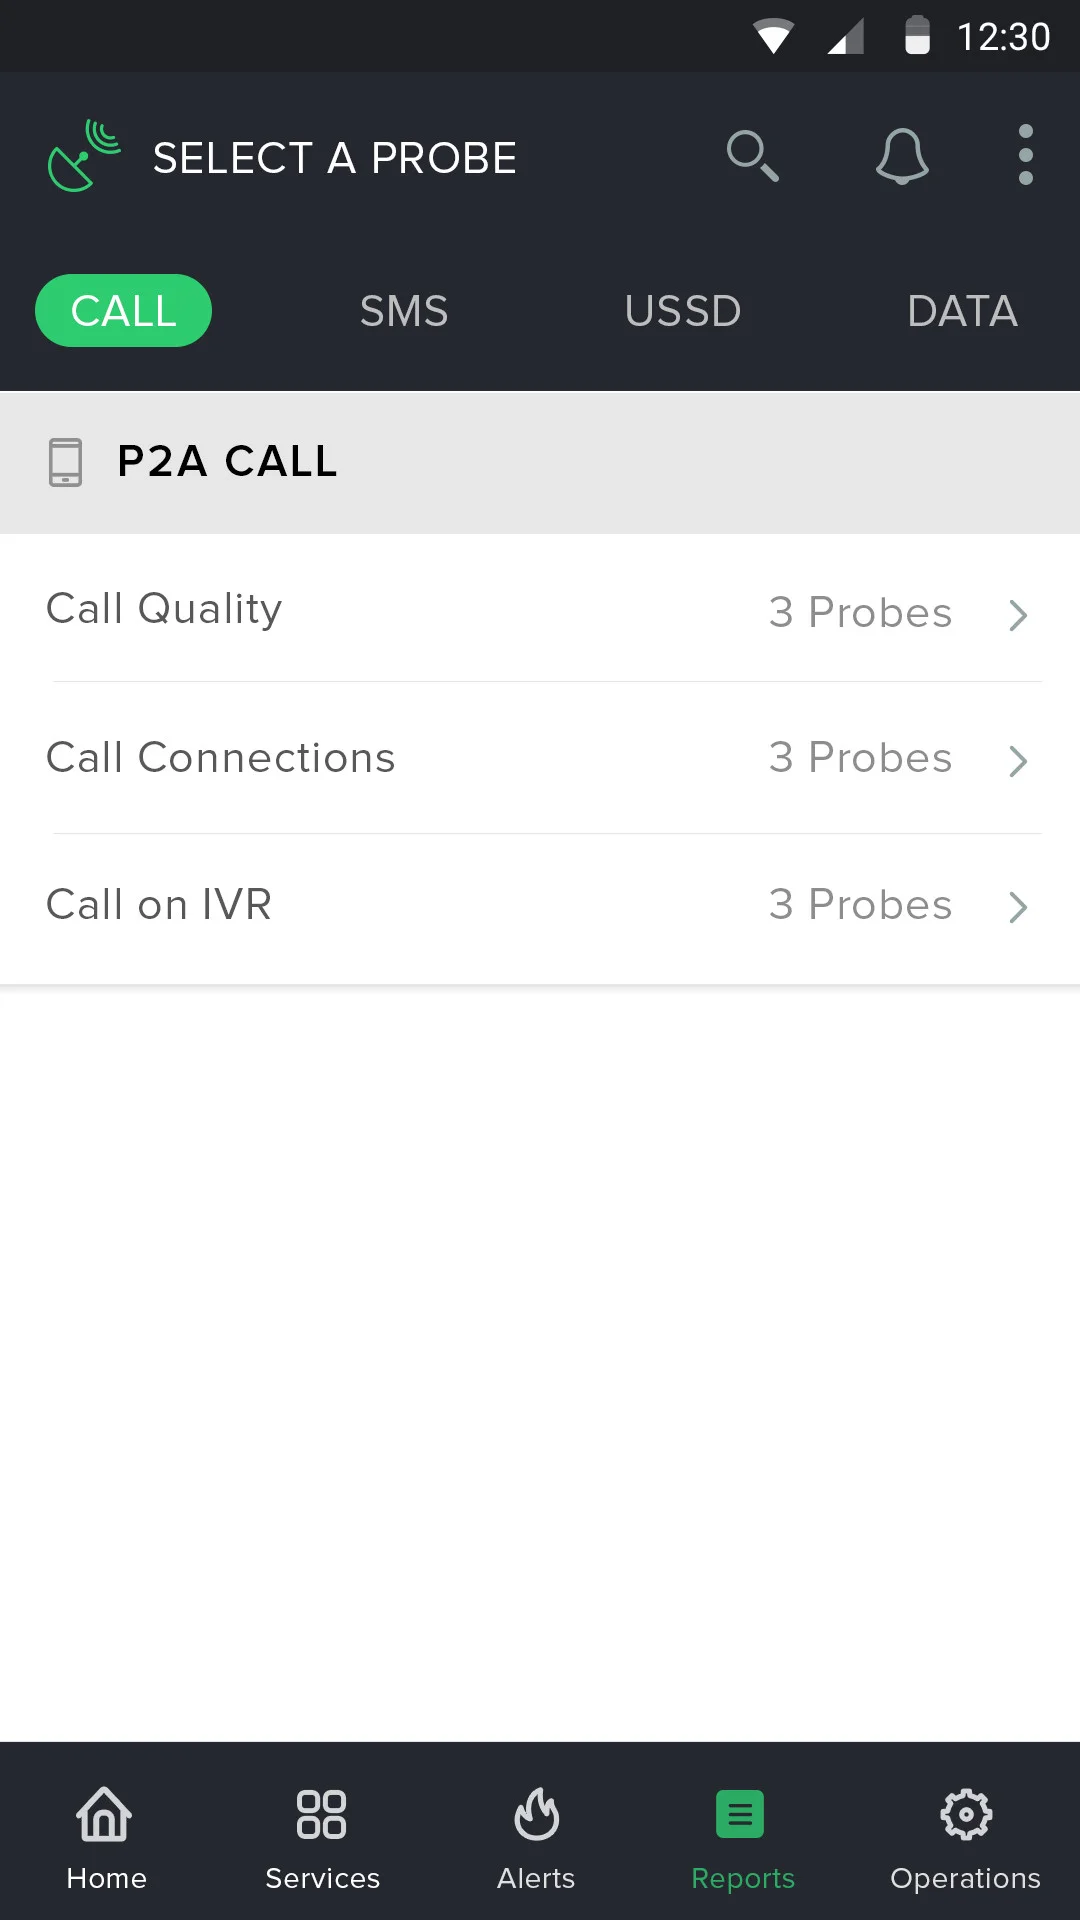
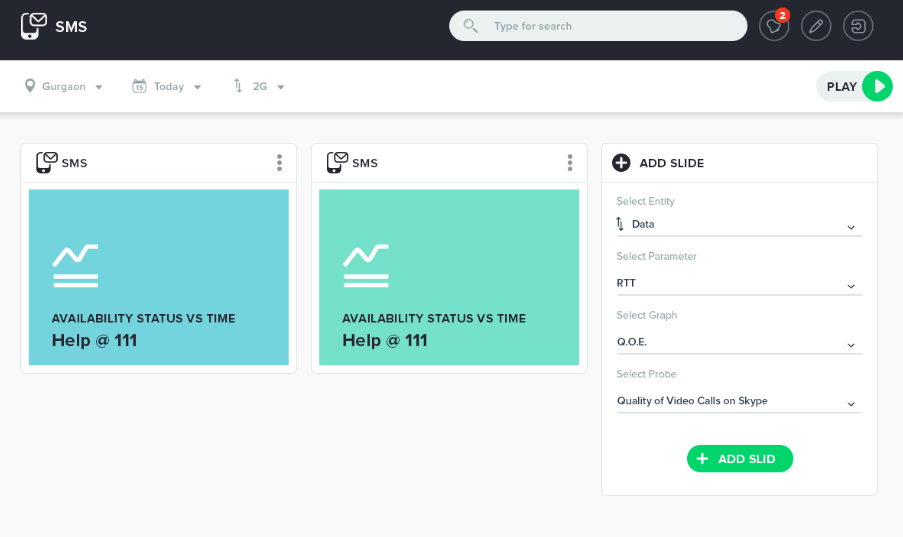
Here is the final UI for the field operator app. There weren't much of features on the app. So it was quite a simple UI to design.
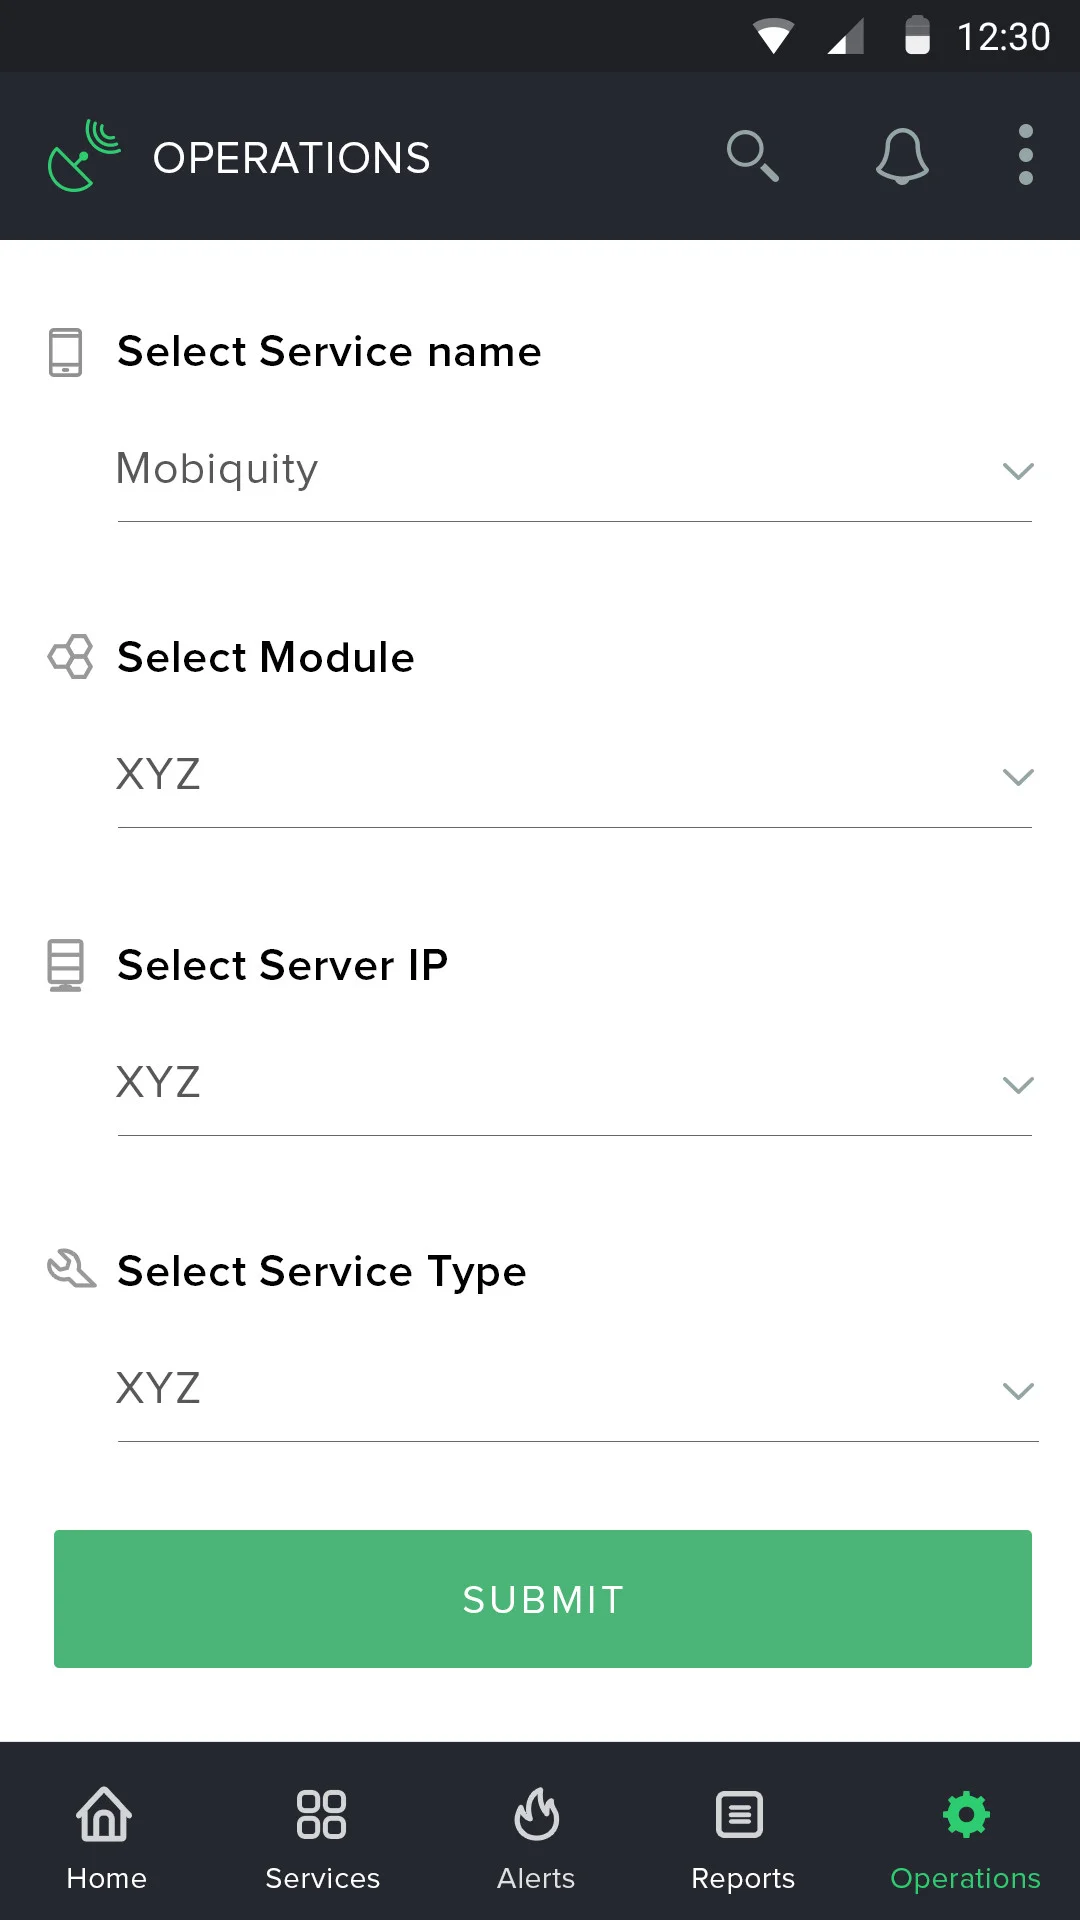
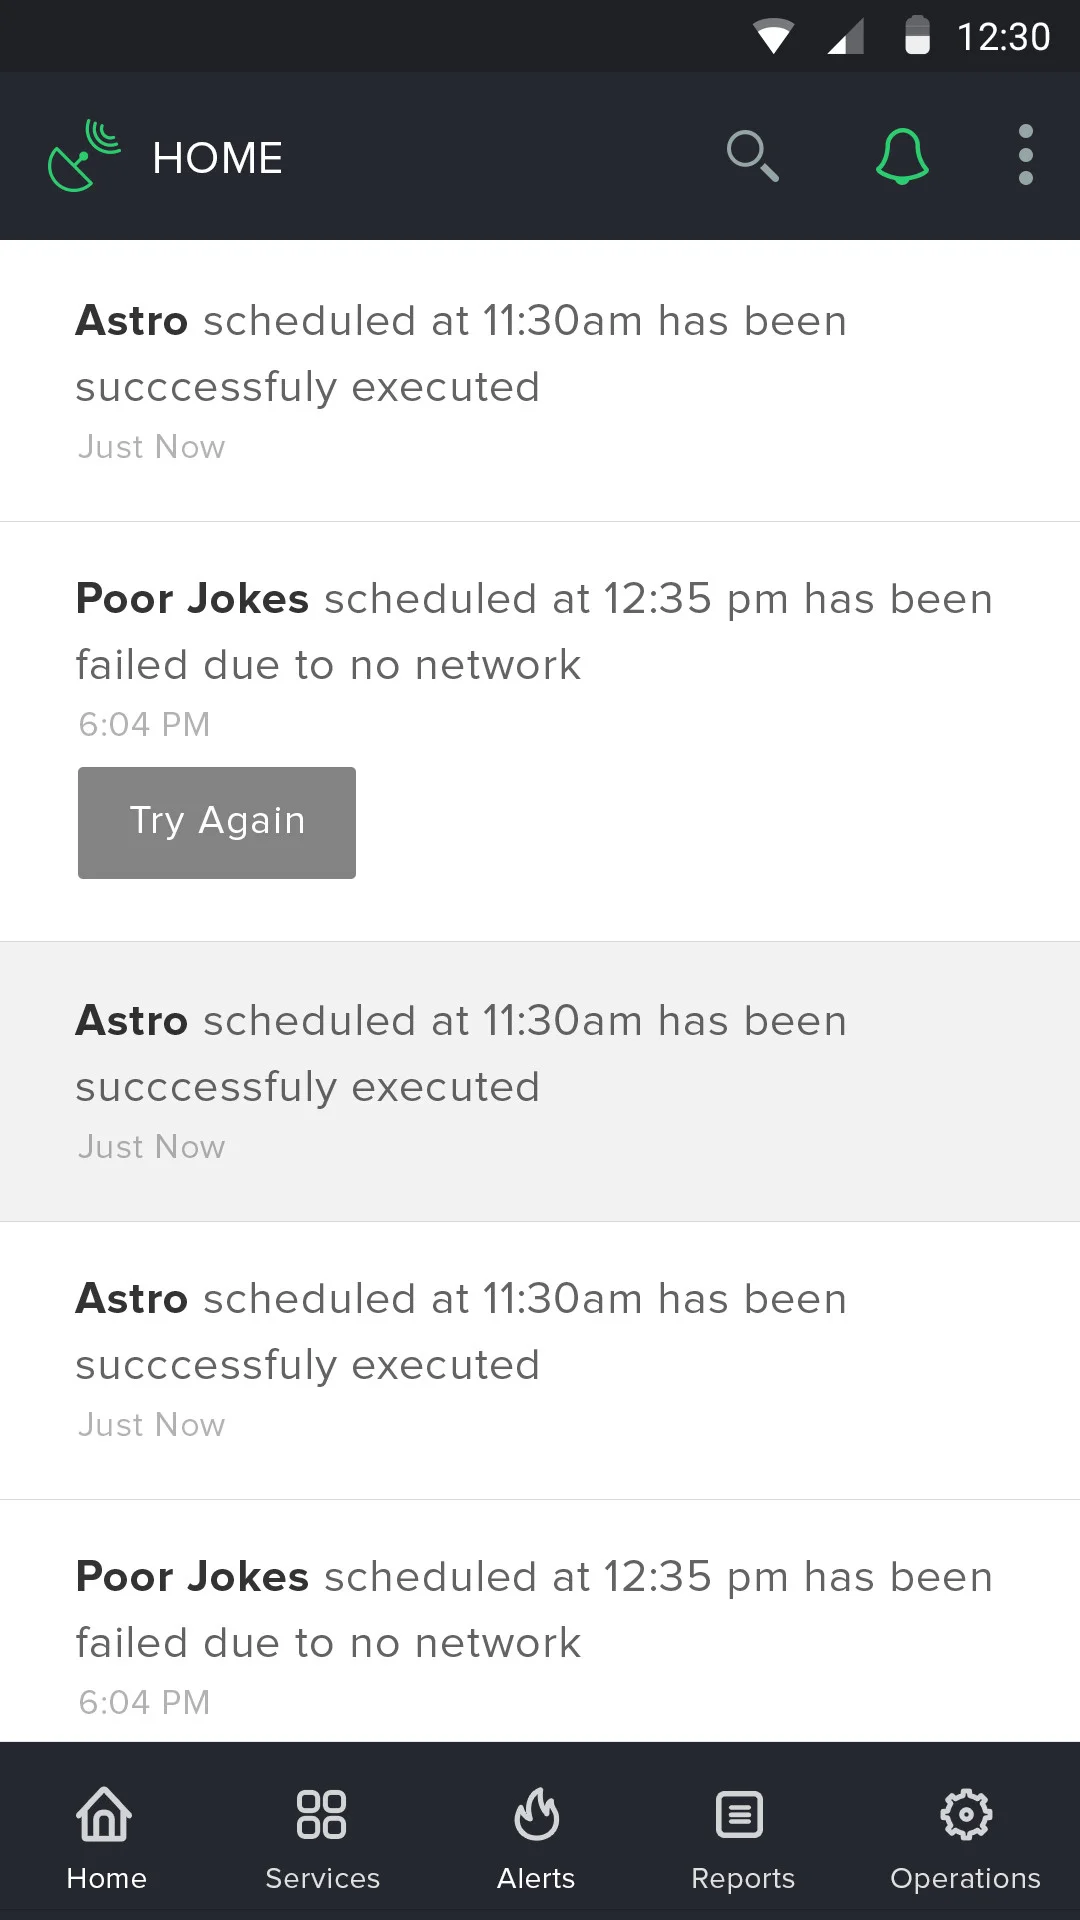
Final app UIs
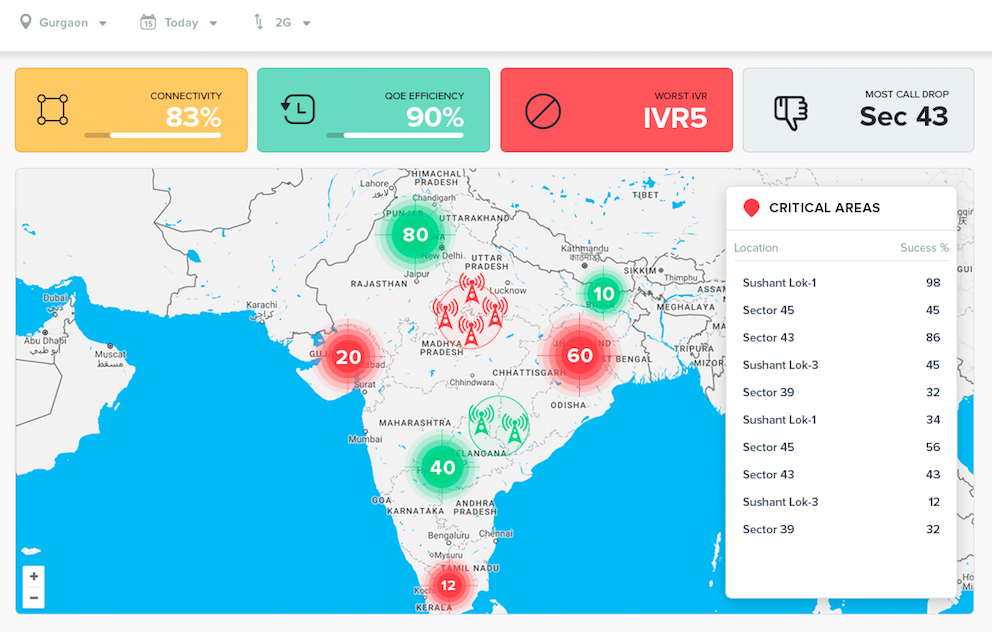
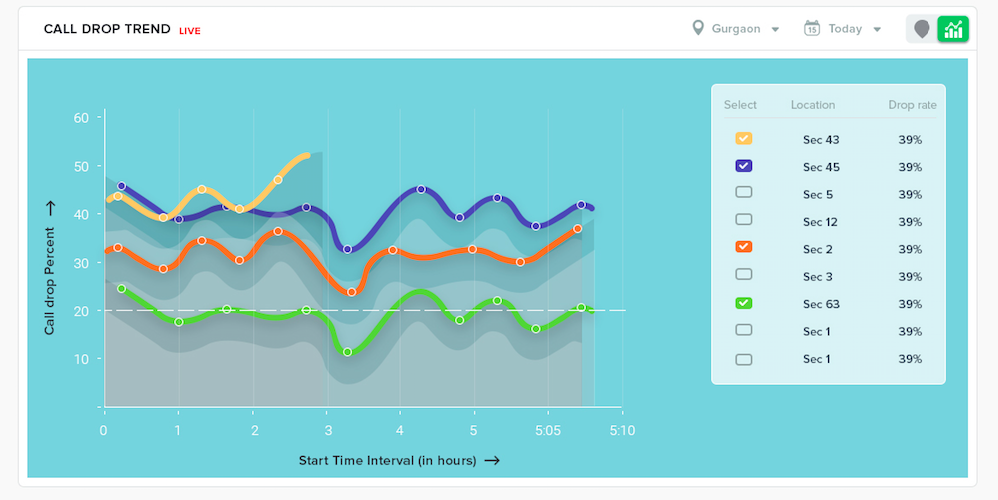
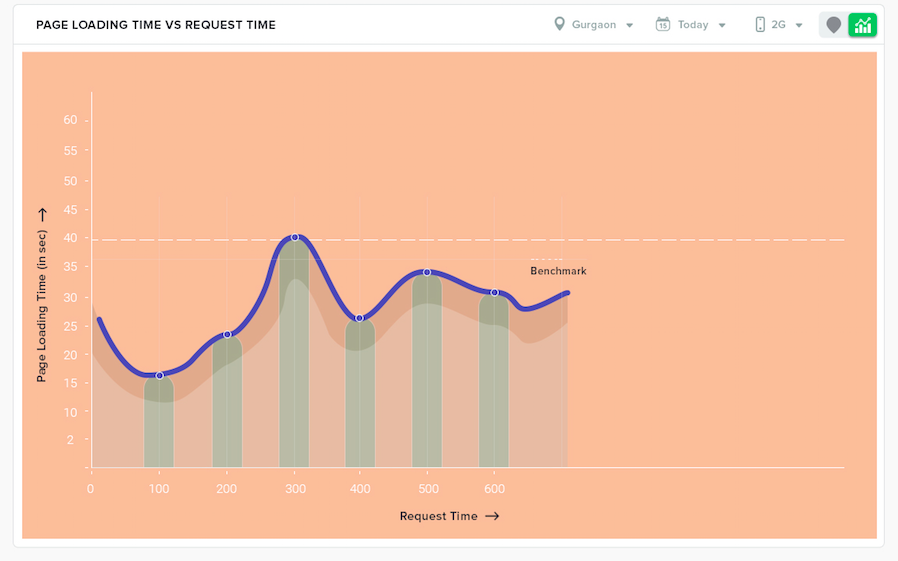
Now comes the final UI for the web app. It took quite a pin in our heads to design this UI as we wanted more than just a plain UI. The parameters & the upfront information that needed to be delivered was a lot in itself to show avoiding clutter.
The right colour palette selection was very important in the process. As our main user persona had age around 30 - 45 years old, Accordingly the colours intensity had to be chosen wisely which they can relate to the specific emotions easily.
THE LIMITATIONS
STAGE OF DEVELOPMENT & TESTING
Once all the UI assets were in place, The development took its pace. As I already defined the key APIs earlier in the documentation to be built & integrated for the purpose. That made the step very smoother. Still many issues arose in integration stage due to poor networks & far located databases at servers.
We used to run multiple tests every day for nearly a week to test every API. One of the biggest restriction we faced was in live tracking of network issues with an required accuracy of 99.3% in case of complete network failure. We were not getting the desired RTT ( round trip delay ) to fetch & deliver the logs in the required mean time.
To resolve that particular issue, We decided to record offline logs ( Lat & Long coordinates ) of every particular location with zero or negligible network reach. These logs were flagged red for individual diagnosis later on to get precise results.
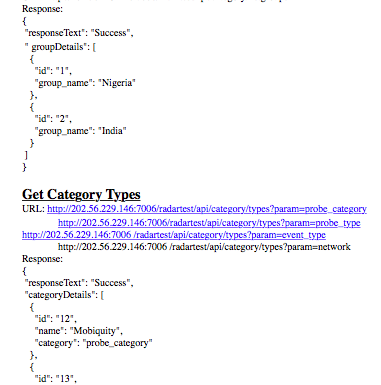
The JSON script for one of the APIs
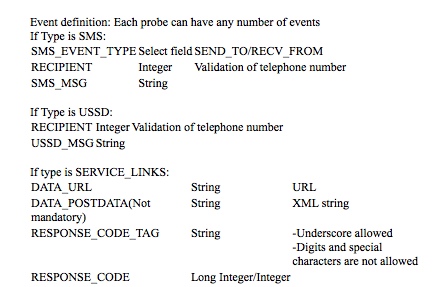
The characteristics of few parameters being used in APIs
THE DELIVERY
ALL ENDS WELL!
Finally, the day of judgement came after nearly 20 weeks of hardships ( yeah, the project stretched for an extra month than the expected timeline due to some additional testing period ). The product went live on a weekend evening. All eyes were on a major screen in the server room. Operators were in the field ready with their apps in their hands. As soon as the start button pressed, The dashboard charts started flowing like free water.
Every person involved in the project was looking at the screen like it was some magic they created. I were standing at last near the wall. The first pulse on the chart was the best moment for me on that day. We all greeted each other for the hard work that they did to make this happen.
Yeah, Some issues came after the launch too, But they were easily handled. And then, A great period of learning about the challenges of an telecom sector came to an end.